ANALYTICS
See how your events are performing — ticket sales, revenue, attendance, and trends — all in one place.
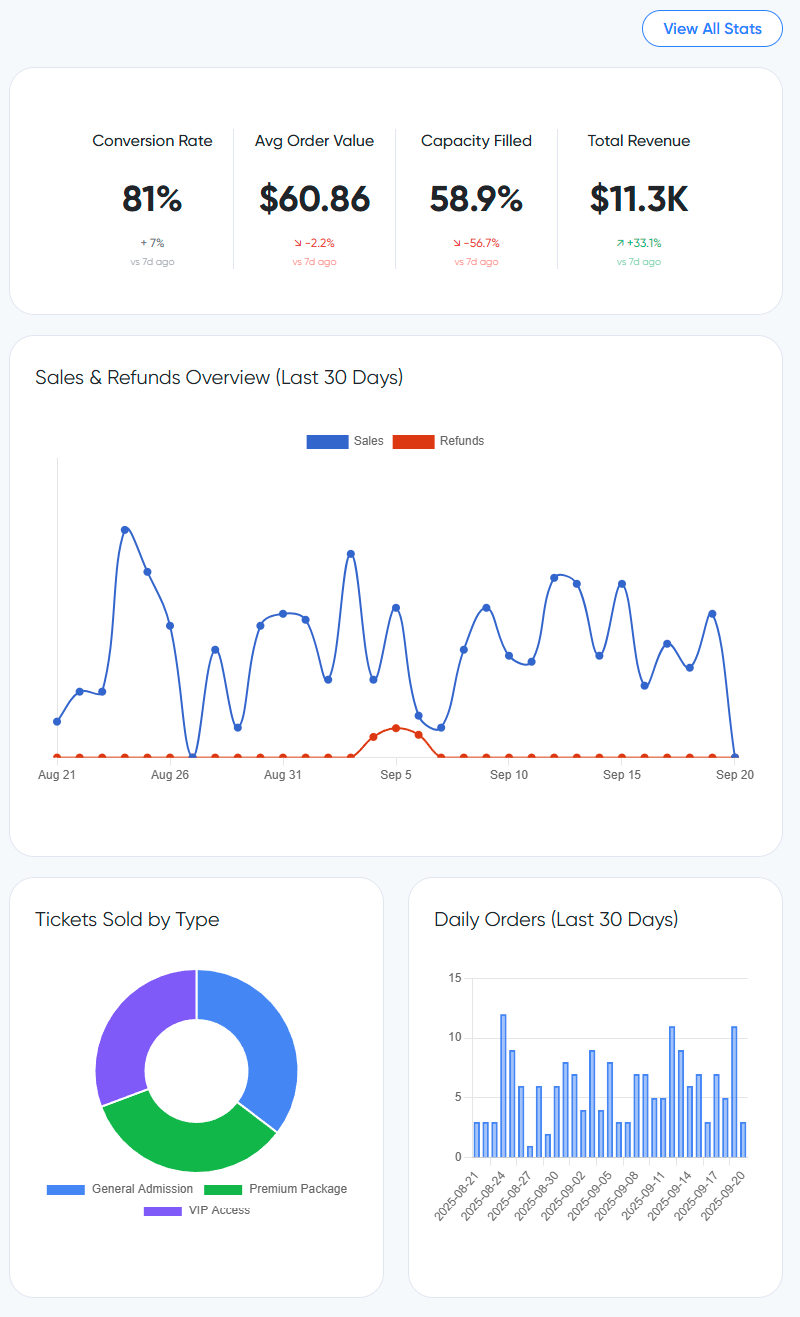
A chart showing ticket sales and revenue by day, so you can see when sales are picking up or slowing down.
See whether sales are up or down compared to the previous week, shown as a simple indicator next to each metric.
See how many registered attendees actually showed up, and how that compares across events.
Break down revenue by each ticket type so you can see which ones are selling and which aren't.
See total refund amounts and how many orders were refunded for each event.
Compare metrics across multiple events to see which formats, prices, or dates perform best.
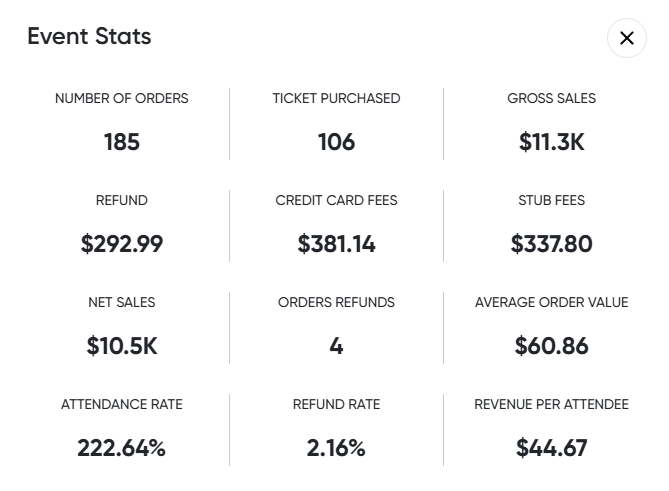
Charts and summary numbers so you can quickly see how each event is doing.

Drill into any event to see a full breakdown of ticket sales, revenue by type, and check-in data.